In my most recent post, I discussed the characteristics of the sun’s 11 and 22 year cycles, the observed laws which describe the behavior of the sunspot cycle, how proxy data is used to reconstruct a record of solar cycles of the past, Grand Solar Maxima and Minima, the relationship between Total Solar Irradiance (TSI) and the sunspot cycle, and the relevance of these factors to earth’s climate system. Before elaborating on the sun’s role in climate change, I’d like to take a look at the mechanism in terms of which the magnetic cycles underlying these solar cycles actually arises, but in order to do that, it’s necessary to first go over some basics:
The Structure of the Sun
The Core: The core of the sun is where pressures and temperatures are high enough to facilitate the nuclear fusion reactions which power the sun (Eddington 1920). The sun is so hot that there are few (if any) actual atoms of hydrogen and helium gas (Bethe 1939). They exist in a plasma state; the gases are ionized and cohabit with free electrons. So protons are being collided and fused into helium nuclei in what’s known as the proton-proton chain (PPO Chain), which is the dominant fusion process in stars of masses comparable to (or less than) the sun. In the PPO chain, two protons fuse and release a neutrino. The resulting diproton either decays back into hydrogen via proton emission, or undergoes beta decay (emitting a positron), which turns one of the protons into a neutron, thus yielding deuterium. The deuterium then reacts with another proton, producing 3He and a gamma ray. Two 3He from two separate implementations of this process then fuse to produce 4He plus two protons (Salpeter 1952).
Image by UCAR: Randy Russell (Windows of the Universe project)
This region comprises about the first 0.2 of the solar radius, and exhibits temperatures on the order of 14 – 15 million Kelvin.
The Radiative Zone: From about 0.2 – 0.7 solar radii from the center is the radiative zone. The nuclear fusion reactions in the core produce radiation which gets reiteratively absorbed and reemitted by various particles in this zone in a random zig-zag pattern. It can take hundreds of thousands of years for photons in this region to reach the surface in this manner. This succession of absorptions and reemissions also results in the photons which escape into the convective zone being of longer wavelength and lower energy than the gamma ray photons that were initially emitted from the nuclear fusion reactions in the core. The temperatures here are still on the order of a few million Kelvin.
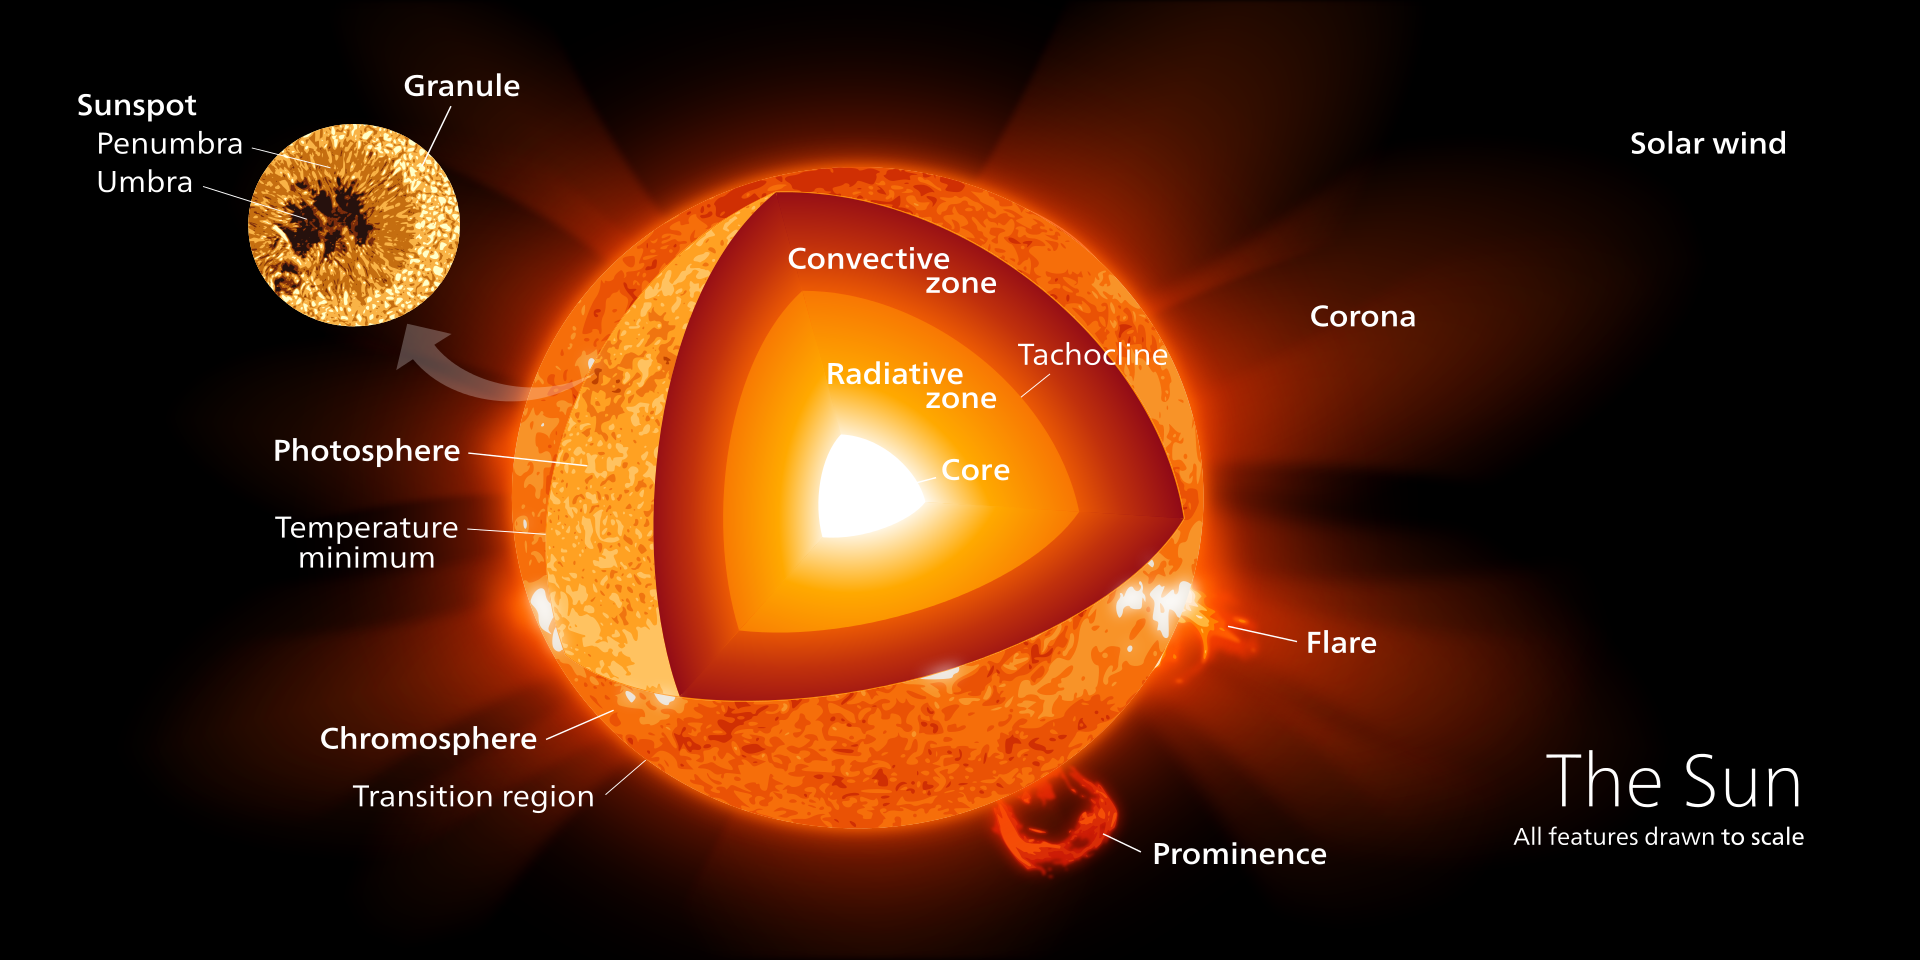
The Layers of the Sun. (Image by Kelvinsong).
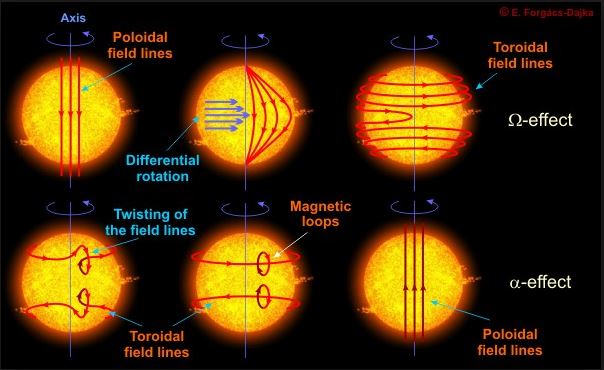
The Tachocline: The interface layer at the boundary separating the radiative zone and convective zone is called the Tachocline. The radiative and convective zones obey different rotational laws, and the advection of angular momentum in the Tachocline (which acts as a transition layer between them) is controlled by horizontal turbulence (Spiegel 1992). Changes in fluid flow velocities across this layer can twist magnetic field lines.
The Convective Zone: This zone runs from about 0.7 solar radii up to the sun’s surface (the Photosphere). As the name implies, heat pockets convect through the ionized gas in this region towards the surface in a manner similar to a boiling pot of water. The convective zone is just cool enough that many of the heavier ions are able to retain at least some of their electrons, which means that the material in the convective zone is more opaque, and thus it’s harder for radiation to get through it. Consequently, a lot of heat gets trapped in this zone, which causes the material to “boil” (or convect). As we’ll see soon enough, this property is important in making possible the solar dynamo mechanism that underlies the solar cycle. The temperature gradient of the convection zone ranges from around 2 million Kelvin near the tachocline to roughly 6,000 Kelvin at the sun’s surface.
The Photosphere: This is the sun’s visible surface layer. The photosphere includes features such as the following:
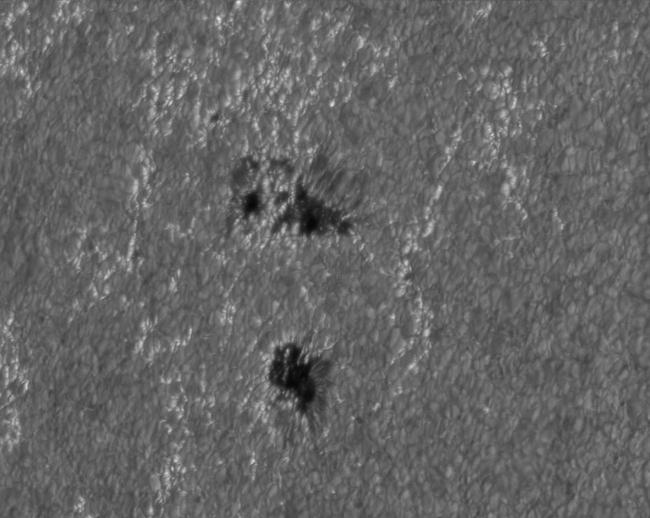
Sunspots: these are dark regions representing high magnetic flux, and are associated with changes in polarity of the sun’s magnetic field (Hale 1908). I’ve already covered some of the properties of sunspots, the sunspot cycle, and how sunspot abundance can be used as a proxy for Total Solar Irradiance (TSI) in a recent post here, and will cover the mechanism underlying the sunspot cycle when I elucidate the Solar Dynamo in a follow-up post.
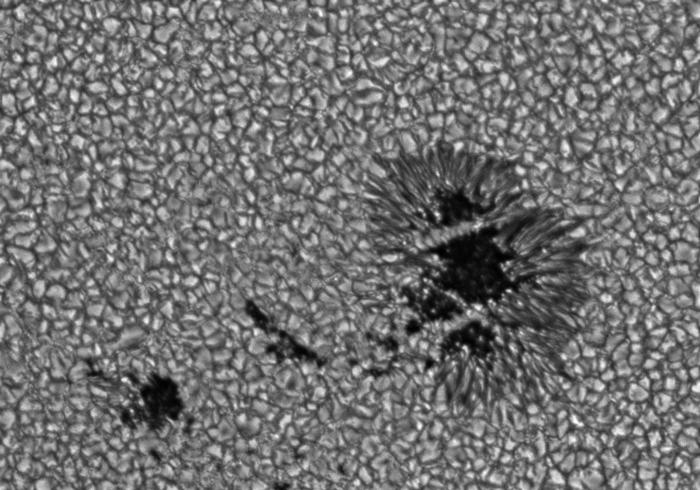
Sunspot c/o NASA
Faculae: these are bright regions which are also highly magnetized, but whose magnetic fields are concentrated in considerably smaller bundles than in sunspots (Richardson 1933). During solar maxima, when abundant dark sunspots are blocking the emission of heat and light, these bright regions overpower the darkening effect of the sunspots, thus resulting in the net increase in luminosity that we observe during solar maxima (Spruit 1982).
Faculae c/o NASA
Granules: these are the tops of convection cells which cover nearly the entire photosphere in ever-changing grain-like patterns (Langley 1874). The bright center bulges of the granules are regions where the plasma is rising to the surface, whereas the darker boundaries around them are where the plasma is cooler and sinking back down.
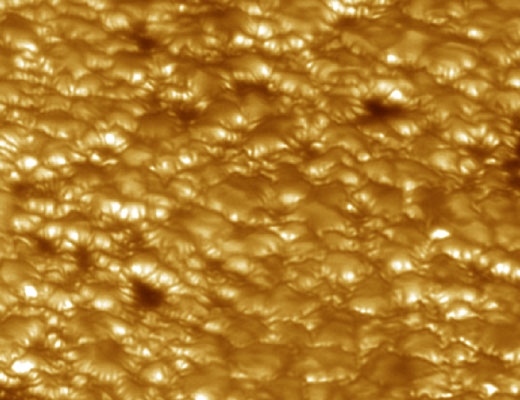
Granules: Image by Goran Scharmer and Mats G. Löfdahl
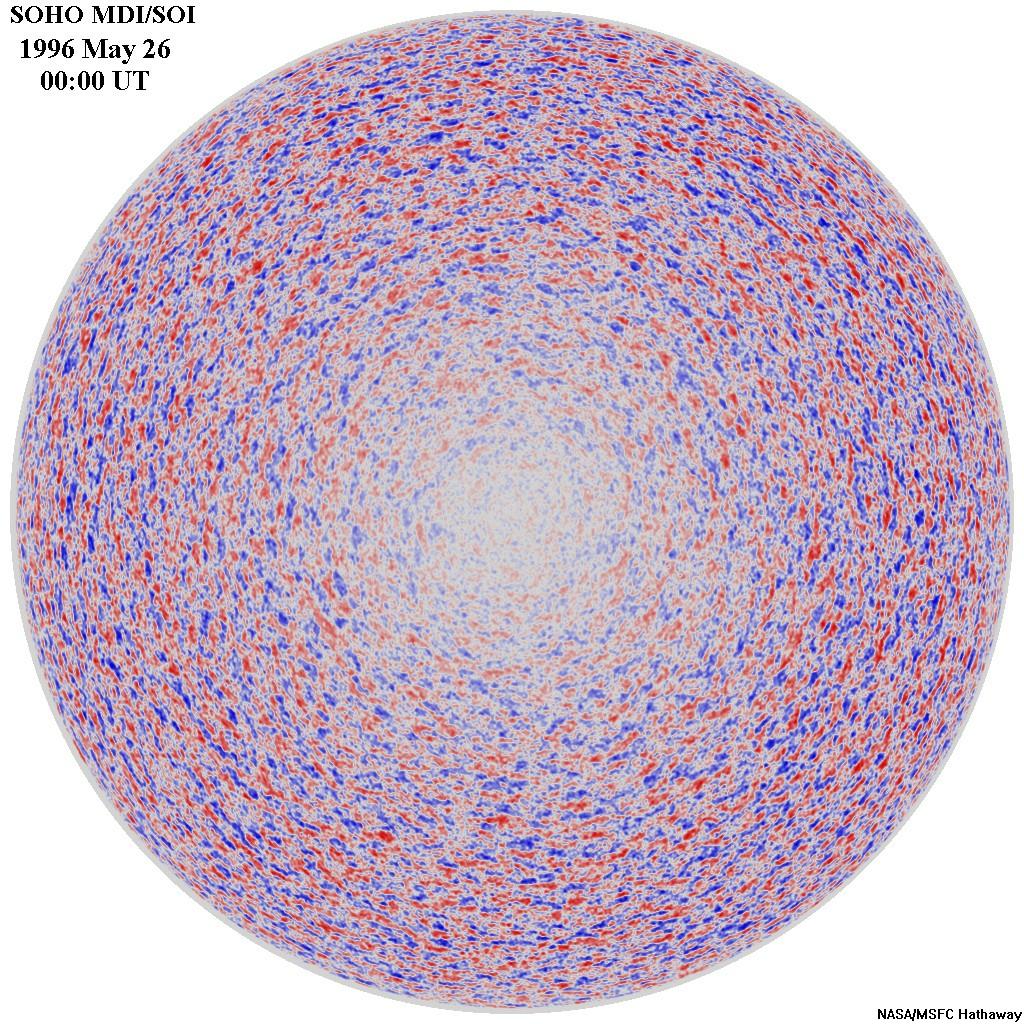
Supergranules c/o NASA
And supergranules: these are huge polygonal convective cells which are larger and last longer than granules, and are outlined by the chromospheric network. They have an average diameter of about 13,000 – 32,000 km and last an average of about 20 hrs (Simon 1964, Hagenaar 1997).
Additionally, the photosphere is also where solar flares originate. For more on solar flares, check out this article from space.com.
The Chromosphere: This is an approximately 2,000 km layer of gas residing above the photosphere, in which temperatures run from around 6,000 – 25,000 K (Vernazza 1976, Carlsson 1994). As a consequence, hydrogen in this layer emits light of a reddish color in a process called H-alpha emission (Michard 1958). The electrons of a particular atom can only occupy certain specific allowed energy states. They are quantized. These states correspond to specific principle quantum numbers, n = 1, n = 2, n = 3 etc… When an electron drops from one allowed energy state to a lower level, it emits a photon whose wavelength (and thus color) corresponds to the difference in energy between those two allowed states. Contrastingly, only a photon corresponding to the exact energy difference between two states can be absorbed by the electron to push it up to the higher energy state. In the limited case of hydrogen-like atoms, the relationship is described by the Rydberg formula, which is as follows:
1/λ = RZ2(1/nf2 – 1/ni2),
where λ is the wavelength of the photon emitted or absorbed, Z is the atomic number of the hydrogen-like atom in question (1 in this case), R is the Rydberg constant (approximately 1.097*10^7 m-1 in S.I. units), ni is the quantum number of the electron’s initial state, and nf is the quantum number of its final state. H-alpha emission occurs when an electron of a hydrogen atom drops from its third lowest allowed energy level (ni = 3) to its second lowest (nf = 2). ). If you plug in these values, you get that λ = 656 nm, which is in the red light range.
This transition is part of what’s called the Balmer series, which consists of all the allowed transitions between ni ≥ 3 and nf = 2 (Bohr 1913).
Other chromospheric features include the chromospheric network, which is a web-like pattern outlining supergranule cells, which results from bundles of magnetic field lines concentrated in the supergranules (Hagenaar 1997). Spicules are jet like eruptions of hot gas which protrude from the chromospheric network thousands of kilometers above the chromosphere and into the corona. Filaments and prominences are huge plumes of gas suspended as loops above the sun by magnetic fields, which underlie many solar flares (Kiepenheuer 1951, Menzel 1960). Plage, which are also associated with concentrations of magnetic field lines, appear as bright spots surrounding sunspots (Leighton 1959).
The Transition Region: This thin region resides between the cooler chromosphere and the much hotter corona. For this reason, temperatures rapidly increase with radial distance outward, ranging from 25,000 K around the boundary of the chromosphere to about 10^6 K out near the corona (Peter 2001).
The Corona: This aura of plasma is the sun’s outer atmosphere. It reaches temperatures far greater than at the sun’s surface (on the order of 1 – 3.5 million degrees Celsius). The reasons for these extreme temperatures comprise a long standing puzzle in solar astrophysics known as the Coronal Heating Problem, which is beyond the scope of this brief outline. That said, these extreme temperatures result in jets of plasma at speeds of up to 400 km/s (Brueckner 1983). Consequently, some of this ionized gas overcomes the sun’s gravitational pull, escapes, and subsequently cools down (Hundhausen 1970). This is the solar wind (Brueckner 1983). Incidentally, there is evidence that the sun’s rotation rate was greater in the past, and that the solar wind is responsible for its subsequent loss of angular momentum (Durney 1977). The corona is also the region from which Coronal Mass Ejections (CME) emerge. As the name implies, these can involve the ejection of billions of tons of plasma as a result of the reconnection of opposite ends of complicated magnetic field loops in the corona, and often accompany strong solar flares and filament eruptions. Not all solar flares and filament eruptions result in a CME though. Solar flares typically involve the expulsion of long radio wave radiation all the way up the EM spectrum through visible light (or even gamma rays), as well as protons and electrons, the latter of which can result in x-ray emissions via bremsstrahlung radiation (Arnoldy 1968). Charged particles in flares are accelerated by a combination of electric fields and magnetohydrodynamic waves (Miller 1997). You can read more about CME events here, here and here and solar flares here and here.
Any one of these layers and properties I’ve described here could be elaborated upon in greater detail, but this should be sufficient for the purpose of seguing into an explanation of the solar dynamo: the physical mechanism in terms of which solar cycles arise, which will be the topic of my next installment of this series.
Related Articles:
- How Continental Drift affects Climate: Part I – Plate Tectonics, Albedo, and the SnowBall Earth Hypothesis
- How Continental Drift affects Climate: Part II – Possible Snowball Earth Triggering Mechanisms + Regional Effects of Mountain Ranges
- Milankovitch Cycles and Climate: Part I – Axial Tilt and Precession
- Milankovitch Cycles and Climate: Part II – Orbital Eccentricity, Apsidal Precession and Orbital Inclination
- Milankovitch Cycles and Climate: Part III – Putting it All Together
- The Climatological effects of Volcanic Eruptions: The End Permian Extinction, the Toba Super-Volcano, and the Volcanic Explosivity Index
- The Ultimate Environmental Cataclysm: Asteroid and Comet Impacts and their Effects on Climate
- The Sun and Earth’s Climate: The Solar Cycle and the Maunder Minimum
References:
Arnoldy, R. L., Kane, S. R., & Winckler, J. R. (1968). Energetic solar flare X-rays observed by satellite and their correlation with solar radio and energetic particle emission. The Astrophysical Journal, 151, 711.
Bethe, H. A. (1939). Energy production in stars. Physical Review, 55(5), 434.
Bohr, N. (1913). The spectra of helium and hydrogen. Nature, 92, 231-232.
Brueckner, G. E., & Bartoe, J. D. (1983). Observations of high-energy jets in the corona above the quiet sun, the heating of the corona, and the acceleration of the solar wind. The Astrophysical Journal, 272, 329-348.
Carlsson, M., & Stein, R. F. (1995). DOES A NONMAGNETIC SOLAR CHROMOSPHERE EXIST?. The Astrophysical Journal, 440, L29-L32.
Durney, B. R., & Latour, J. (1977). On the angular momentum loss of late-type stars. Geophysical & Astrophysical Fluid Dynamics, 9(1), 241-255.
Eddington, A. S. (1920). The internal constitution of the stars. The Scientific Monthly, 297-303.
Hagenaar, H. J., & Schrijver, C. J. (1997). The distribution of cell sizes of the solar chromospheric network. The Astrophysical Journal, 481(2), 988.
Hale, G. E. (1908). On the probable existence of a magnetic field in sun-spots. The astrophysical journal, 28, 315.
Hundhausen, A. J. (1970). Composition and dynamics of the solar wind plasma. Reviews of Geophysics, 8(4), 729-811.
Kiepenheuer, K. O. (1951). The Nature of Solar Prominences. Publications of the Astronomical Society of the Pacific, 63, 161.
Langley, S. P. (1874). On the structure of the solar photosphere. Monthly Notices of the Royal Astronomical Society, 34, 255.
Leighton, R. B. (1959). Observations of Solar Magnetic Fields in Plage Regions. The Astrophysical Journal, 130, 366.
Menzel, D. H., & Wolbach, J. G. (1960). On the Fine Structure of Solar Prominences. The Astronomical Journal, 65, 54.
Michard, R. (1958). INTERPRETATION OF THE H* alpha/SPECTRUM OF THE CHROMOSPHERE. Compt. rend., 247.
Miller, J. A., Cargill, P. J., Emslie, A. G., Holman, G. D., Dennis, B. R., LaRosa, T. N., … & Tsuneta, S. (1997). Critical issues for understanding particle acceleration in impulsive solar flares. Journal of Geophysical Research: Space Physics, 102(A7), 14631-14659.
Peter, H. (2001). On the nature of the transition region from the chromosphere to the corona of the Sun. Astronomy & Astrophysics, 374(3), 1108-1120.
Richardson, R. S. (1933). A Photometric Study of Sun-Spots and Faculae. Publications of the Astronomical Society of the Pacific, 45(266), 195-198.
Salpeter, E. E. (1952). Nuclear reactions in the stars. I. Proton-proton chain. Physical Review, 88(3), 547.
Simon, G. W., & Leighton, R. B. (1964). Velocity Fields in the Solar Atmosphere. III. Large-Scale Motions, the Chromospheric Network, and Magnetic Fields. The Astrophysical Journal, 140, 1120.
Spiegel, E. A., & Zahn, J. P. (1992). The solar tachocline. Astronomy and Astrophysics, 265, 106-114.
Spruit, H. C. (1982). The flow of heat near a starspot. Astronomy and Astrophysics, 108, 356-360.
Vernazza, J. E., Avrett, E. H., & Loeser, R. U. D. O. L. F. (1976). Structure of the solar chromosphere. II-The underlying photosphere and temperature-minimum region. The Astrophysical Journal Supplement Series, 30, 1-60.
Image Credits:
Layers of the Sun by Kelvinsong (Own work) [CC BY-SA 3.0 (http://creativecommons.org/licenses/by-sa/3.0)], via Wikimedia Commons
Granules by Goran Scharmer/Mats G. Löfdahl of the Institute for Solar Physics at the Royal Swedish Academy of Sciences.
Proton-Proton chain Image by UCAR: Randy Russell (Windows of the Universe project)
Sunspots, Faculae, and Supergranules by NASA

4 Comments
William D. Starr · February 26, 2017 at 2:44 pm
“The interface layer at the boundary separating the radiative zone and convective zone is called the Tachocline. The radiative and convective zones obey different rotational laws…”
Can you recommend someplace where a layman like me can find an explanation of this, at roughly the same information-to-comprehensibility ratio as, e.g., this article of yours right here?
Credible Hulk · May 7, 2017 at 4:38 am
Sorry for the late reply. I don’t know of very many off hand, but this presentation goes into it a little.
http://cmso.info/cmsopdf/Cattaneo.pdf
This one is a bit more technical, but my understanding is that it’s the paper in which the term was coined.
http://adsabs.harvard.edu/full/1992A%26A…265..106S
The Solar Dynamo: The Physical Basis of the Solar Cycle and the Sun’s Magnetic Field – The Credible Hulk · January 13, 2017 at 11:01 pm
[…] The Structure and Properties of the Sun […]
The One True Argument^TM – The Credible Hulk · April 30, 2017 at 4:08 am
[…] impacts can affect the climate with hundreds of citations from credible scientific journals here, here, here, here, here, here, here, here, here, here, here, and […]
Comments are closed.