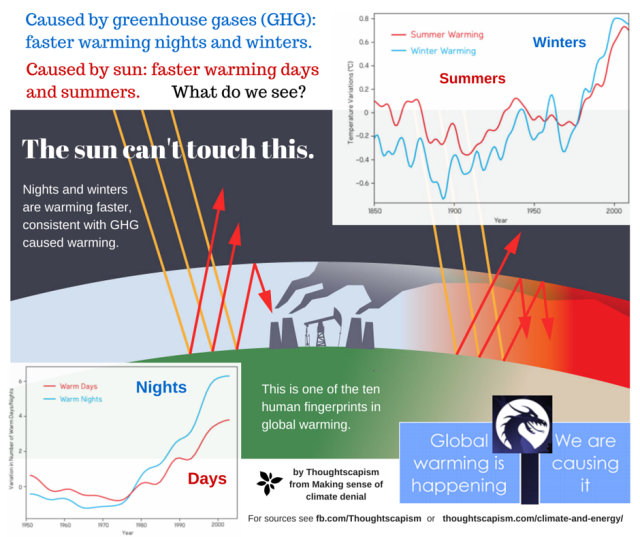
No, Solar Variations Can’t Account for the Current Global Warming Trend. Here’s Why:

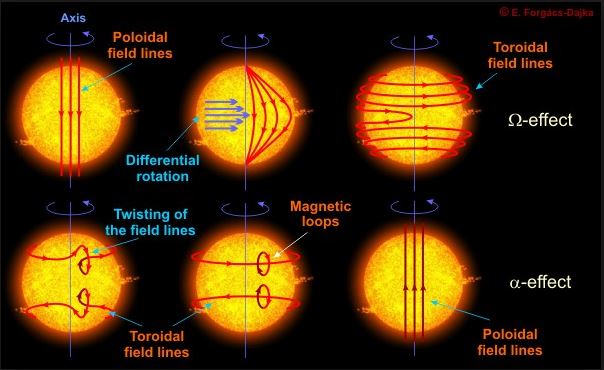
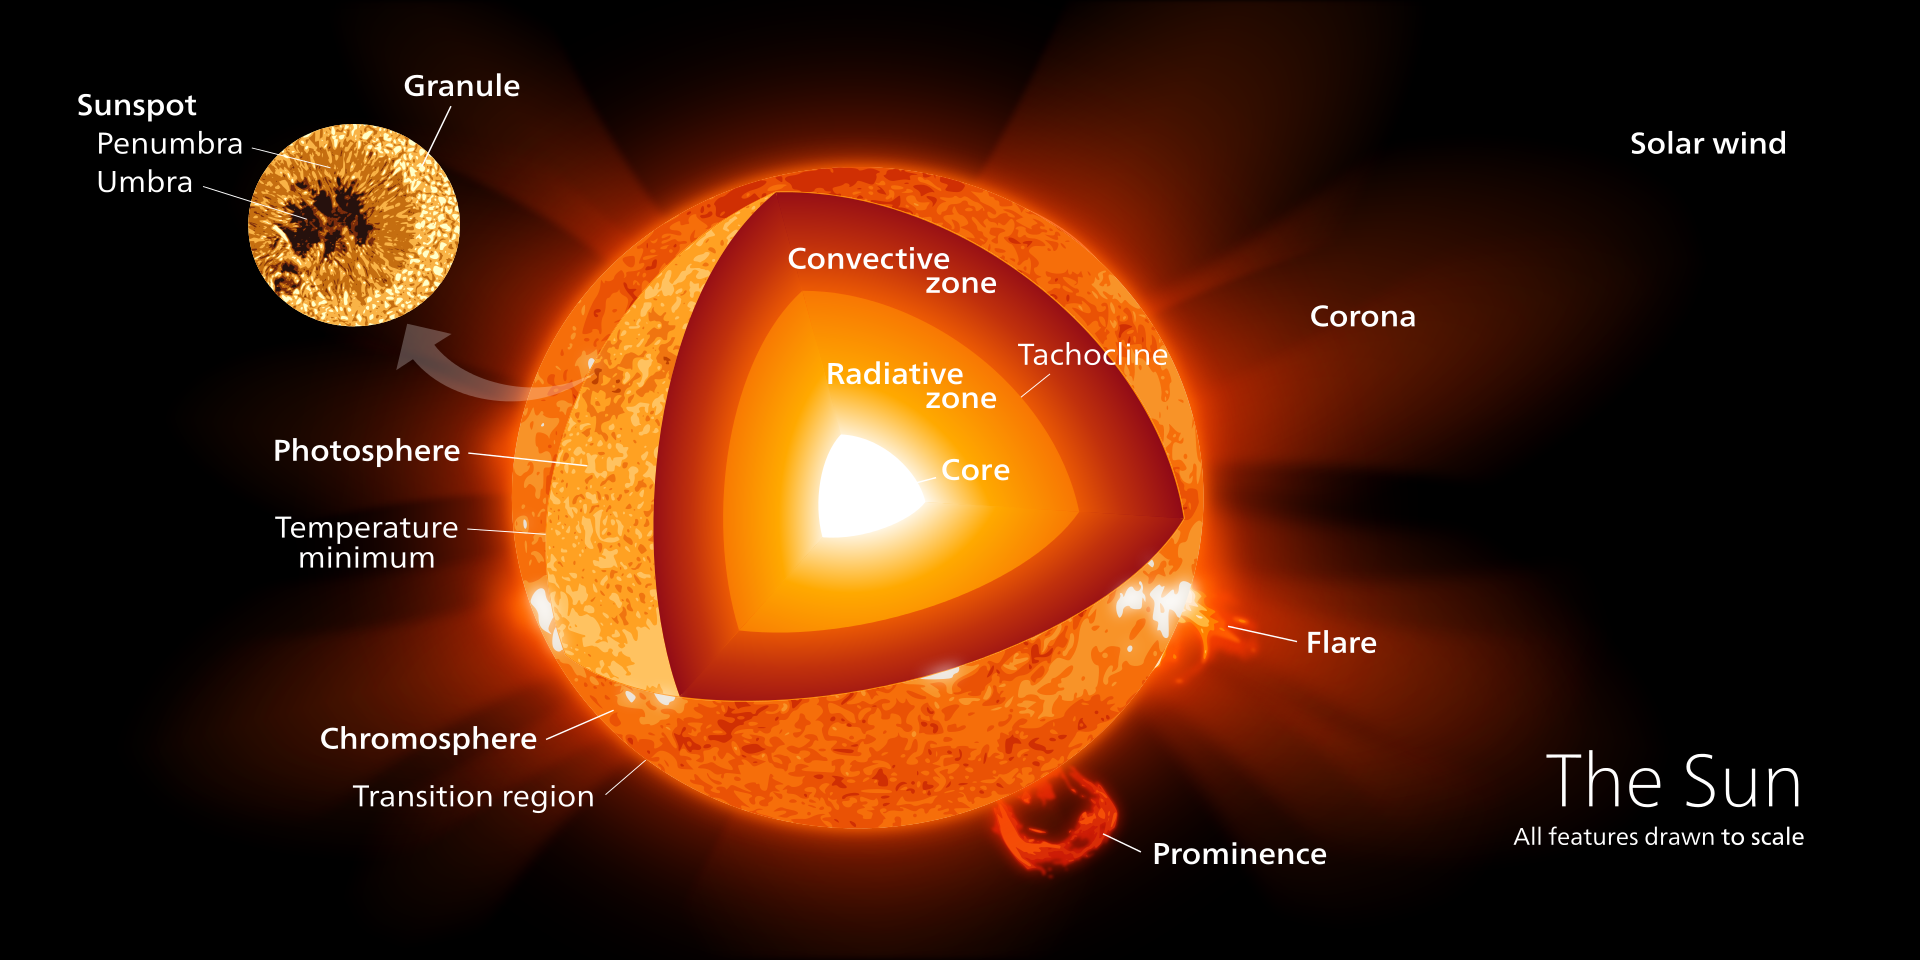
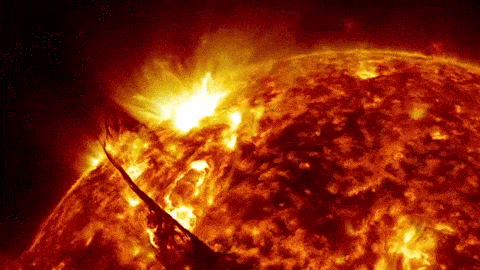
In part I of this series on the sun and Earth’s climate, I covered the characteristics of the sun’s 11 and 22 year cycles, the observed laws which describe the behavior of the sunspot cycle, how proxy data is used to reconstruct a record of solar cycles of the past, Grand Solar Maxima and Minima, the relationship between Total Solar Irradiance (TSI) and the sunspot cycle, and the relevance of these factors to earth’s climate system. In part II, I went over the structure of the sun, and some of the characteristics of each layer, which laid the groundwork for part III, in which I explained the solar dynamo: the physical mechanism underlying solar cycles, which I expanded upon in part IV, in which I talked about some common approaches to solar dynamo modeling, including Mean Field Theory. This installment covers how all of that relates to climate change and the current warming trend. (more…)

Share

The Solar Dynamo: The Physical Basis of the Solar Cycle and the Sun’s Magnetic Field

In my previous article, I laid out some basics about the sun’s structure and physical characteristics in order to set up the groundwork upon which I could then explain the physical mechanism which underlies the solar cycles I talked about in the article prior to that one. I understand that this is a bit more technical than most readers may be accustomed to, which is why I’ve included a simplified “tl; dr” version before delving deeper.

Solar Dynamo Theory

The leading scientific explanation for the mechanism by which these solar cycles emerge is the solar dynamo theory. It arises from an area of physics called magnetohydrodynamics, which is the field which studies the magnetic properties of electrically conducting fluids, and is covered in most university textbooks on plasma physics. So how does it work?

The tl; dr version is as follows: (more…)

Share

The Structure and Properties of the Sun

In my most recent post, I discussed the characteristics of the sun’s 11 and 22 year cycles, the observed laws which describe the behavior of the sunspot cycle, how proxy data is used to reconstruct a record of solar cycles of the past, Grand Solar Maxima and Minima, the relationship between Total Solar Irradiance (TSI) and the sunspot cycle, and the relevance of these factors to earth’s climate system. Before elaborating on the sun’s role in climate change, I’d like to take a look at the mechanism in terms of which the magnetic cycles underlying these solar cycles actually arises, but in order to do that, it’s necessary to first go over some basics:

The Structure of the Sun

The Core: The core of the sun is where pressures and temperatures are high enough to facilitate the nuclear fusion reactions which power the sun (Eddington 1920). The sun is so hot that there are few (if any) actual atoms of hydrogen and helium gas (Bethe 1939). They exist in a plasma state; the gases are ionized and cohabit with free electrons. So protons are being collided and fused into helium nuclei in what’s known as the proton-proton chain (PPO Chain), which is the dominant fusion process in stars of masses comparable to (or less than) the sun. In the PPO chain, two protons fuse and release a neutrino. The resulting diproton either decays back into hydrogen via proton emission, or undergoes beta decay (emitting a positron), which turns one of the protons into a neutron, thus yielding deuterium. The deuterium then reacts with another proton, producing 3He and a gamma ray. Two 3He from two separate implementations of this process then fuse to produce 4He plus two protons (Salpeter 1952).  (more…)

Share

The Sun and Earth’s Climate: The Solar Cycle and the Maunder Minimum

The Solar Cycle

The Sun goes through an approximately 11 year periodic solar cycle (Gnevyshev 1967). This cycle includes variations in solar irradiation, the amount of ejected materials, solar flares and sunspot activity. Total Solar Irradiance (TSI) is measured in power per unit area (energy per unit time per unit area), and is of particular importance in that it represents the total incoming energy driving the climate system.

Since we’ve only had direct satellite measurements of TSI since the mid-late 1970s, estimates of solar output for earlier times were (and are) based on one or more proxies. Sunspot observations are one such proxy. Sunspot abundance correlates strongly with TSI, so they can thus be used as a proxy for solar maxima and minima. Astronomers have recorded telescopic sunspot observations since the early 1600s, and there is evidence of naked eye observations dating much further back (Stephenson 1990). In addition to noticing that the number of sunspots oscillated in 11 year cycles, astronomers also noticed that sunspots would first appear in pairs or groups at about 30 – 35 degrees both North and South of the solar equator, and the mean latitudes of subsequently appearing spots would tend to migrate towards the solar equator as the cycle progressed, a phenomenon referred to as Spörer’s Law (Carrington 1858, Carrington 1863, Spörer 1879). (more…)

Share